1) Step 1- Problem or Opportunity Statement
In previous posts (W13 and W14), we have mentioned processes map for estimating and budgeting that owners can use as a guide to calculate the optimum cost estimate for developing future assets.
It was missing an analysis to determine what processes are equivalent between each other and identify if all of the alternatives have most of the processes required to produce an optimum outcome.
In addition, we can assess if we can combine them and get a more complete process for estimating and budgeting.
2) Step 2 – Feasible Alternatives
We have chosen the following entities:
- AACE International: Cost Estimating and Budgeting Process Map from Total Cost Management Framework
- Guild of Project Controls: Overall Cost Estimating and Budgeting Process Map
- Government Accountability Office: Cost Estimating Process
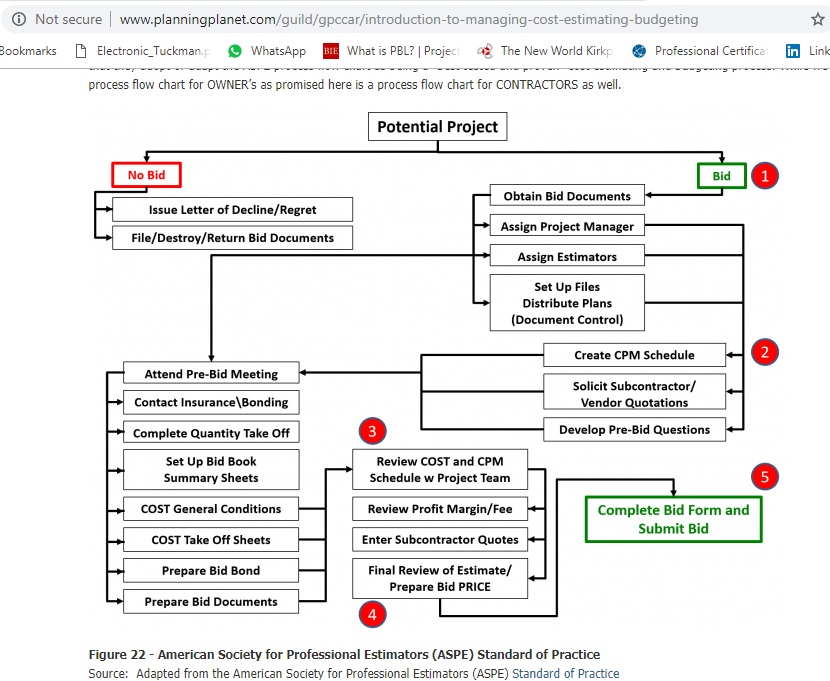
- American Society of Professional Estimators: Standard of Practice
- Project Management Institute: Project Management Body of Knowledge – Project Cost Management
3) Step 3- Develop the outcomes for each alternative
Total Cost Management from AACE International suggests the following Process for Cost Estimating and Budgeting:

Guild of Project Controls suggest the following process map

GAO suggest the following Cost Estimating Process

ASPE suggest the following Process Map:
Project Management Institute: Project Management Body of Knowledge – Project Cost Management

4) Step 4- Selection of the acceptable criteria.
We will compare processes if they have the following characteristics:
- Similar description
- Similar outputs
In case it is necessary, we will group processes that combined produce a very similar output.
5) Step 5- Compare the outcomes from each alternative analysis done in Step 3 against the minimum acceptable criteria from Step 4.
We have made a table to compare Processes between each other that meet acceptable criteria. We have added a column to show the outputs expected in each process. A red line represents the end of an expected process.
Colours represent the following:
Green: The process or group of processes produce the output on the first column.
Yellow: The process produces the output, not as an independent process but a subprocess. It happens that the outcome is produced by another process not included in this process map.
Red: The outcome is not produced at all by any process.

Notes
1. TCM
1.1 “Validation” happens during “Review and Document Estimate” process.
1.2 “Baseline” happens during “Budget Costs” process.
1.3 “Approval” happens during Project Implementation Process, during the “Authorize and Accept Project” process.
2. GPC:
2.1 “Budget” happens in the process 08.4.3.10 Budget, Authorization or Control (GPC Level 3 Cost Estimate), 08.6.3.2 Contractor Cost Baseline, Bid or Tender - (GPC Level 5 Cost Estimate) and 08.10.3.1 Communicate the Cost Estimate / Cost Budget
2.2 “Cash Flows” happens in process “09.3.3.2.3 Reviewing Both Owner and Contractor Cash Flows” which is a process included in “Measuring Capturing Progress Updating the Schedule” Module. This process is not include it in the Process Map shown.
2.3 "Approval" happens in process “Define Top Down Cost Estimate (Owner)” in the sub process 08.4.3.10 Budget, Authorization or Control (GPC Level 3 Cost Estimate) for the OWNER and in the process “Developing Bottom Up Cost Estimate (Contractor)” as an output for the CONTRACTOR.
2.4 “Tendering” happens during 08.6.3.3 What is Activity Based Costing with a note that it also appears in 05.4.3.6 Contractors Cost Estimating, Budgeting and Bidding Process
3. GAO:
3.1 GAO’s process “Develop point estimate and compare it to an independent cost estimate” was split in two, “Develop Point Estimate” and “Compare it to an independent cost estimate”. So, it can be equivalent to validation processes of GPC.
3.2 “Budget” and “Analyze Cash Flow” happen during “Develop Point Estimate” process.
3.3 “Tendering” is not mentioned in GAO’s guide.
4. ASPE:
4.1 It does not show any process after finishing Cost Estimate and Quantity take-off. The author does not have the standard of ASPE to research if any other documents are outcomes of other processes.
4.2 “Tendering” can be included in the process of “Set up Bid Book Summary Sheets”.
5. PMI:
5.1 “Validation” happens during “Estimate Cost” process. The process includes a Decision Making technique to vote for the best outcome.
5.2 “Risk Analysis” happens during “Estimate Cost” process. As shown in the flow, the Risk Register is updated as an output of the process.
5.3 “Analyze Cash Flow” happens during “Develop Schedule” process. The output “Schedule Data” contains information about cashflow projections.
5.4 “Documentation” happens as a result of “Estimate Costs”. The Basis of Estimate is a result as part of Project Documents.
5.5 “Baseline” happens as a result of “Determine Budget” process.
5.6 “Approval” happens during “Determine Budget” process.
5.7 “Tendering” is not mentioned at all as a result of the Cost Management Process. It is only mentioned as an output for the Procurement Management Process to request proposals.6) Step 6- Selection of the “best”.
As shown in the table above, GPC and GAO have continuity in their processes until to deliver an “assessment of the estimate”. These two are better than TCM which do not have a validation or revision of the estimate before simulation. TCM does the review at the moment of documentation of the estimate, after few processes later and a preliminary revision or validation could be good to find out errors or missing data in the estimate.
Then we can notice that GAO and GPC do not show any process for budgeting or cashflow but as explained in the previous step, those processes are included in other processes. Perhaps, a better process map can show all the processes are considered to prepare an optimum estimate
7) Step 7- How to plan on tracking/reporting on recommended choice.
The next step is to determine what the attributes are to determine what a good process for estimating and budgeting is.
The next step is to determine what the attributes are to determine what a good process for estimating and budgeting is.
8) REFERENCES.
1. Guild of Project Controls. (2015, October 03). 08.01 Introduction to Managing Cost Estimating Budgeting Rev 1.03. Retrieved September 15, 2018, from http://www.planningplanet.com/guild/gpccar/introduction-to-managing-cost-estimating-budgeting
2. Guild of Project Controls. (2015, October 03). 08-4 Creating_the_owners_cost_estimate_top_down_-_rev_1.02. Retrieved September 15, 2018, from http://www.planningplanet.com/guild/gpccar/creating-the-owners-cost-estimate
3. Guild of Project Controls. (2015, October 03). 08-6_developing_the_contractors_cost_estimate_bottom_up_-_rev_1.01. Retrieved September 15, 2018, from http://www.planningplanet.com/guild/gpccar/developing-the-contractors-cost-estimate-bottom-up
4. Guild of Project Controls. (2015, October 03). 09-3_measuriing__capturing_progress__updating_the_schedule_-_rev_1.03. Retrieved September 15, 2018, from http://www.planningplanet.com/guild/gpccar/capturing-progress-updating-schedule
5. H. Lance Stephenson. (2015). Total cost management framework: An Integrated Approach to Portfolio, Program, and Project Management (2nd ed.). Morgantown, WV: AACE International. Page 176 - 183
6. GAO Cost Estimating and Assessment Guide- Best Practices for Developing and Managing Capital Program Costs. Page 8.
7. A Guide to the Project Management Body of Knowledge (PMBOK® Guide), 6th ed. Newton Square, Pa: Project Management Institute, Inc. 2017. Page 231- 270


AWESOME analysis!!! Now your paper is really going to give us something to look at and compare. The only part I am still not thrilled about is your table from Step 5. Just brainstorming, but what I would do is color in the cells- green if fully met or addressed, yellow if meets partially or as part of another process, with a note in the cell to see explanatory commment below (probably should renumber all of them sequentially so we know which note goes with which cells?) and red if the process map does NOT address it at all.
ReplyDeleteThe reason I am being so critical of this is you've done a lot of work on this and you've produced something of very high value that will be useful for others to use and reference. Using color coding is also consistent with MADM "Dominance" method and should only take you another 15-20 minutes to fix.
And I would not do a new post, just update your table and replace it with the new one.
BR,
Dr. PDG, Jakarta
Thanks Paul. I think your comment will help to produce a good post. I will work on it.
DeleteBR
Piero
Nope not quite right yet. I cannot speak for the others but for the GPC there should be NO blocked out cells.
ReplyDeleteBUDGET should be green and noted as appearing in 08.4.3.10 Budget, Authorization or Control (GPC Level 3 Cost Estimate), 08.6.3.2 Contractor Cost Baseline, Bid or Tender - (GPC Level 5 Cost Estimate) and 08.10.3.1 Communicate the Cost Estimate / Cost Budget
Cash Flows should be Yellow with a note as it appears here 09.3.3.2.3 Reviewing Both Owner and Contractor Cash Flows
Tendering should be Green as it appears here in 08.6.3.3 What is Activity Based Costing with a note that it also appears in 05.4.3.6 Contractors Cost Estimating, Budgeting and Bidding Process. So either green or yellow with notes is appropriate,
You will have to do the same for the other options as well. The only time there should be black lines is if the topic is not addressed at all or only so peripherally as to not have any material impact on the process.
BR,
Dr. PDG, Jakarta
PS IF the attribute from the left hand column is INCLUDED in the process map, then shouldn't the color be green? If the attribute is not covered in the process map you've shown but is covered elswhere in the "Body of Knowledge" shouldn't it be yellow with a note showing where it is covered?
ReplyDeleteAnd only those attributes that are not covered at all or are only covered on the periphery should be red?
In looking over your color coding, you need to be more clear in explaining how you determined each color.
BR,
Dr. PDG, Jakarta
Hi Paul. I understood what you suggested. I hope this time is better.
DeleteBR
Piero
EXCELLENT Piero!!! Very well done!!! Unless I have missed something, this MADM analysis using DOMINANCE sets the stage for you to:
ReplyDelete1) Eliminate ASPE from further consideration on the grounds you lack information.
2) Based on your MADM analysis, CONCLUDE your paper by making specific RECOMMENDATIONS to AACE, GPC, GAO and PMI as to what improvements they can or should consider adding/changing to make their standards "better".
IF you wish you could also take your MADM analysis one more step beyond DOMINANCE and give each of the attributes w weighting using the NON-DIMENSIONAL SCALING method? Not sure how much more value doing this will add as no matter what weightings you choose, they would be subject to challenges, so maybe you are better off just to stick with Dominance as the basis to make your recommendations?
BR,
Dr. PDG, Jakarta
Question- Under GPC, why are BUDGET and APPROVAL OF ESTIMATE not green? They all appear in 08.x processes?
ReplyDeleteI do agree that CASH FLOW and TENDERING should be yellow but I am having a hard time understanding why the other two are shown as yellow? You need to explain your color coding more clearly. And there is no problem as long as you have been consistent in how you applied them across all of the Feasible Alternatives...
BR,
Dr. PDG, Jakarta
Thanks Paul for your comments. Regarding your question, maybe is not clear that for yellow is also for sub-processes. Budget and Approval are sub-processes of "8.4 Developing Top-Down Cost Estimate (Owners)" and "8.6 Developing a Bottom-Up Cost Estimate (Contractors)" respectively. They are not processes for themselves.
DeleteI hope this answer your question.
BR
Piero
Thanks for the best content
ReplyDeleteGREAT WORK
BIM Implementation