1) Step 1- Problem or Opportunity Statement
In previous posts (W13 and W14), we have mentioned processes map for estimating and budgeting that owners can use as a guide to calculate the optimum cost estimate for developing future assets.
It was missing an analysis to determine what processes are equivalent between each other and identify if all of the alternatives have most of the processes required to produce an optimum outcome.
In addition, we can assess if we can combine them and get a more complete process for estimating and budgeting.
2) Step 2 – Feasible Alternatives
We have chosen the following entities:
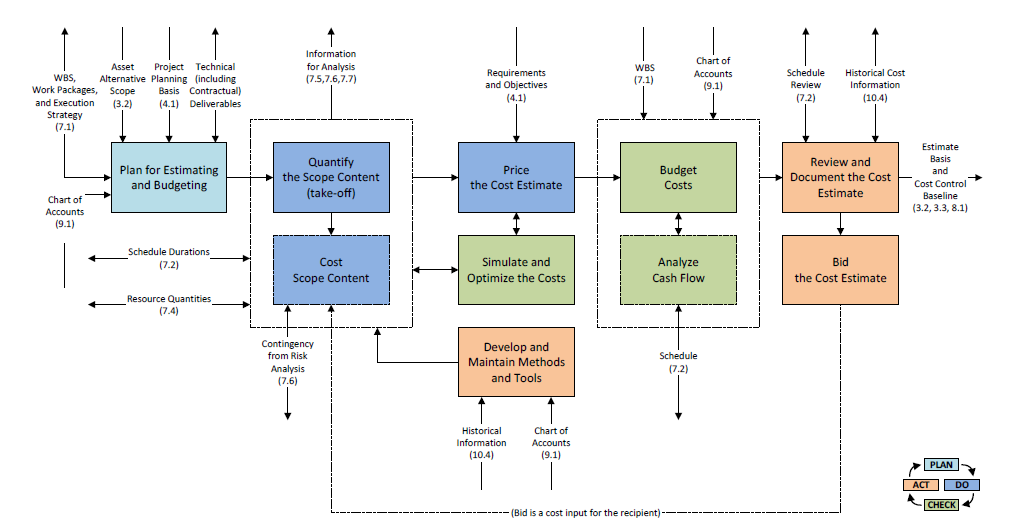
- AACE International: Cost Estimating and Budgeting Process Map from Total Cost Management Framework
- Guild of Project Controls: Overall Cost Estimating and Budgeting Process Map
- Government Accountability Office: Cost Estimating Process
- American Society of Professional Estimators: Standard of Practice
- Project Management Institute: Project Management Body of Knowledge – Project Cost Management
3) Step 3- Develop the outcomes for each alternative
Total Cost Management from AACE International suggests the following Process for Cost Estimating and Budgeting:

GAO suggest the following Cost Estimating Process

ASPE suggest the following Process Map:

Project Management Institute: Project Management Body of Knowledge – Project Cost Management


4) Step 4- Selection of the acceptable criteria.
We will compare processes if they have the following characteristics:
- Similar description
- Similar outputs
In case it is necessary, we will group processes that combined produce very similar output.
5) Step 5- Compare the outcomes from each alternative analysis done in Step 3 against the minimum acceptable criteria from Step 4.
We have made a table to compare Processes between each other that meet acceptable criteria. We have added a column to show the outputs expected in each process. A red line represents the end of an expected process.

Note: for GAO’s process “Develop point estimate and compare it to an independent cost estimate” was split in two, “Develop Point Estimate” and “Compare it to an independent cost estimate”.
Notice than ASPE and PMI do not show any validation of information or any risk assessment before the Budgeting.
6) Step 6- Selection of the “best”.
As shown in the table above, GPC and GAO have continuity in their processes until to deliver an “assessment of the estimate”. These two are better than TCM which do not have validation or revision of the estimate before simulation. TCM does the review at the moment of documentation of the estimate, after few processes later and a preliminary revision or validation could be good to find out errors or missing data in the estimate.
Then we can notice that GAO and GPC do not show any process for budgeting or cashflow that could be added to complement their processes.
7) Step 7- How to plan on tracking/reporting on recommended choice.
The next step is to determine what the attributes are to determine what a good process for estimating and budgeting is.
8) REFERENCES.
1. Guild of Project Controls. (2015, October 03). 08.01 Introduction to Managing Cost Estimating Budgeting Rev 1.03. Retrieved September 15, 2018, from http://www.planningplanet.com/guild/gpccar/introduction-to-managing-cost-estimating-budgeting
2. H. Lance Stephenson. (2015). Total cost management framework: An Integrated Approach to Portfolio, Program, and Project Management (2nd ed.). Morgantown, WV: AACE International. Page 176
3. GAO Cost Estimating and Assessment Guide- Best Practices for Developing and Managing Capital Program Costs. Page 8.
4. A Guide to the Project Management Body of Knowledge (PMBOK® Guide), 6th ed. Newton Square, Pa: Project Management Institute, Inc. 2017. Page 231
4. A Guide to the Project Management Body of Knowledge (PMBOK® Guide), 6th ed. Newton Square, Pa: Project Management Institute, Inc. 2017. Page 231


Good morning, Piero,
ReplyDeleteBad news. I have to reject this posting, on the grounds you chose the wrong graphics to illustrate the data flow for PMI. What you are going to have to do is take screen shots of Figures 7-3, 7-5, 7-7 and 7-11, paste them into a ppt slide then add in any missing logic links to tie the 4 separate process flow charts together. This will produce a single graphic that looks very much like the other process flow maps you've created for AACE, GPC, GAO and ASPE. This will be really important for the readers of your paper to be able to visualize and compare the process flow charts.
Other than that, I LOVE your Step 5 table!!! That is exactly the kind of analysis I was hoping you would produce. I think if you fix that one problem with the graphics you will have created another very unique and special paper.
Keep up the good work!!! Really excited about this paper and looking forward to seeing you complete it!!!
BR,
Dr. PDG, Jakarta
Hi Paul. Thanks for your comments. I will work on PMI's process map.
DeletePS Piero, I found a couple of "errors" or "omission" in your table that you are going to need to address or resolve. (Maybe using notes?)
ReplyDelete"Budget" for the GPC happens in 08.6.3.4 Components of Activity Based Costing
"Documentation" for the GPC happens in MODULE 08-4 - CREATING THE OWNERS COST ESTIMATE (TOP DOWN) Figures 4-7
"Cash Flows" for the GPC happens in module 09.3.3.2.3 Reviewing Both Owner and Contractor Cash Flows
"Approval" for the GPC happens in 08.4.3.10 Budget, Authorization or Control (GPC Level 3 Cost Estimate) for the OWNER and 08.6.4 OUTPUTS for the CONTRACTOR.
For background information, as the primary author of the GPC's Compendium I used the AACE TCMF and RP11-R-88 as a checklist so there is NOTHING that AACE has produced that is NOT in the GPCCaR, but it may not be in the same place.
You will have to do the same detailed analysis for the GAO and PMI as well, noting that the attributes may NOT appear as part of the process map you are analyzing but may appear in OTHER process maps. I think in your table as long as you note that it is not missing, but appears elsewhere that should be sufficient.
BR,
Dr. PDG, Jakarta
Ok Paul. I will add notes to the table. I did not want to go into the detail because I do not have ASPE standard to do the same analysis.
Delete