Friday, 9 November 2018

W9_Piero_Anticona_Strategic/Tactical Response for Risk/Opportunities in Public Point Estimates

1)    Step 1- Problem or Opportunity Statement
Most of Public Projects do not allow to add contingency to their budgets. Public Projects processes and plans to design and execute future assets are not different from private enterprises. Therefore, Public Projects are not exempt from risk and opportunities when executing project activities. When a risk or opportunity occurs sometimes an impact needs the best as you could predict, a tactical or strategical response.
What are best practices to a Risk Management Process that can help to implement the best strategical or tactical response to an event and especially that can adapt to Public Projects if we want a high confidence level of probability to meet project point estimates?
2)    Step 2 – Feasible Alternatives
Most common best practices are:
1.    Project Management Body of Knowledge (PMBOK) from Project Management Institute
2.    Total Cost Management Framework (TCM) from AACE International
We are going to add:
3.    Compendium and Reference (CaR) from Guild of Project Controls

The three of them offer Risk Management Process Maps. See maps below:

1.    PMBOK – PMI
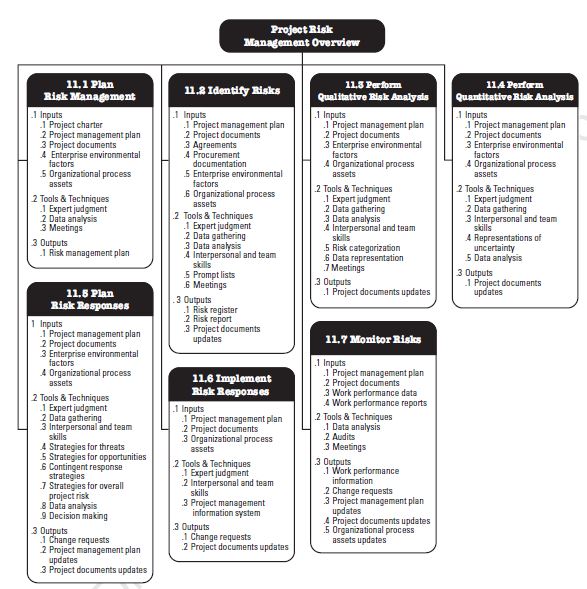
PMI- Risk Management Process Map


2.    TCM – AACE International
TCM - Risk Management Process Map


3.    Guild of Project Controls
GPC - Risk Management Process Map


3)    Step 3- Develop the outcomes for each alternative
                As explained above, we need to determine which of the three offers better tools or techniques to respond to impacts when events occur.
We will analyze risk/opportunities response on strategies and tactics to treat risk/opportunities. What are the steps to implement a plan to treat risk/opportunities? Let’s see following lists:
Comparison of Tools and Techniques 
   
        For an effective analyze, we are going to eliminate those tools or techniques that are similar in the three groups. The main reason is that as they are similar, results will be the same for the three groups. So, it will not produce a differentiator between them which might not add value to the analysis. Also, Expert Judgement can be eliminated because as shown in the table above an individual or group of experts will produce the same responses as described in another item that will go for further analysis. 
.

Eliminated items
        Therefore, we only are going to analyze the following list. TCM as all of the tool and techniques are similar to PMBOK and GPC is eliminated for the analysis.
Final Tools and Techniques for Analysis
To facilitate the analysis we are going to list the outcomes alternatives as follows:


1
PMBOK – Data Gathering
PMBOK-DG
2
PMBOK – Interpersonal and Team Skills
PMBOK-I&TS
3
PMBOK – Strategies for Threats/Opportunities Escalate
PMBOK-Escalate
4
PMBOK – Contingent Response Strategies
PMBOK-Contingent
5
PMBOK - Data Analysis
PMBOK-DA
6
PMBOK – Decision Making
PMBOK-DM
7
GPC – Buffer vs. Contingency
GPC-BvsCont
8
GPC – Decision Trees using EMV
GC-EMV

4)    Step 4- Selection of the acceptable criteria.
The following attributes will be considered for the selection criteria:
Mandatory to Produce a Quantitative response
- It is possible to be assigned to project budget accounts
- Increase Probability to Meeting Point Estimates


5)    Step 5- Compare the outcomes from each alternative analysis done in Step 3 against the minimum acceptable criteria from Step 4.

              Using Multiattribute Decision Making, we will analyze as follows:
              
              Non Compensatory Models

1.    Dominance

Conclusion
     We can see that alternative GPC – BvsCont dominate others

2.    Satisficing


Conclusion
So far, the only alternative that meets all requirements is GPC Buffer vs Contingency. Alternatives PMBOK-DG,PMBOK-I&TS,PMBOK-Escalate,PMBOK-Contingent can be discarded.

3.    Lexicography


Conclusion
GPC BvsCont is better than GPC - EMV

Compensatory Models
1.    Non-Dimensional Escaling


Conclusion
The best choice is GPC – BvsCont

2.    The additive weighting technique



Conclusion
                      The best choice is GPC – BvsCont


6)    Step 6- Selection of the “best”.

      It is important for Public Projects to avoid cost overruns. For that reason, the best choice that meet all of the attribute criteria is GPC – Buffer vs Contingency as shown in the previous step. 5 positive results out of 5. 
          As Contingency is not allowed it can be hidden or create a buffer so it still complies public policies. In addition, it will help to increase probabilities to meet point estimates. 

7)    Step 7- How to plan on tracking/reporting on the recommended choice. 

A good recommendation for further analysis is to identify which of the three best practices can help to track better this alternative as part of the change management process.
----------

8)    REFERENCES.
H. Lance Stephenson. (2015). Total cost management framework: An Integrated Approach to Portfolio, Program, and Project Management (2nd Ed.). Morgantown, WV: AACE International. Page 201.
Guild of Project Controls. (2016, January 05). 04.5 risk_opportunity_responses_strategies_and_tactics_-_rev1.00. Retrieved September 15, 2018, from http://www.planningplanet.com/guild/gpccar/risk_opportunity_responses_strategies_and_tactics
A Guide to the Project Management Body of Knowledge (PMBOK® Guide), 6th ed. Newton Square, Pa: Project Management Institute, Inc. 2017. 
Sullivan, W. G., Wicks, E. M., & Koelling, C. P. (2012). Decision making Considering Multiattributes. In Engineering Economy (15th ed.). Harlow, England: Pearson Education Limited.

Saturday, 3 November 2018

W8.1 Sensitivity Analysis and Contingency

1)    Step 1- Problem or Opportunity Statement
During the preparation of Cost Estimates, GAO recommends as a best practice a Sensitivity Analysis in order to identify Cost Drivers in the Cost Estimate and how it is affected when a change in a cost driver’s value happens. This Sensitivity Analysis must be complemented with Risk and Uncertainty Analysis, therefore, mitigation steps will be part of the assumptions in a Basis of Estimate Document. This analysis will help to determine ranges of potential cost as a previous step of Risk and Uncertainty assessment.
As explained in the first post of the blog, contingency can be allocated following two strategies. Once is an amount buried in a cost account and another one is a buffer in a cost account.
What is the best strategy that responds to a variation in factors used in sensitivity analysis?
2)    Step 2 – Feasible Alternatives
There two strategies to allocate contingency. The following options will be taken into consideration:
1.    Include Contingency
a.    Include it and show it and put it in a contingency project account
b.    Include it but Bury it in project accounts

3)    Step 3- Develop the outcomes for each alternative
We will determine a qualitative analysis to determine which of the following factors have most impact in a project. Then we will choose which strategy responds better to an impact of the following factors suggested by GAO in a sensitivity analysis:
1.    a shorter or longer economic life;
2.    the volume, mix, or pattern of workload;
3.    potential requirements changes;
4.    configuration changes in hardware, software, or facilities;
5.    alternative assumptions about program operations, fielding strategy, inflation rate, technology heritage savings, and development time;
6.    higher or lower learning curves;
7.    changes in performance characteristics;
8.    testing requirements;
9.    acquisition strategy, whether multiyear procurement, dual sourcing, or the like;
10. labor rates;
11. growth in software size or amount of software reuse; and
12. down-scoping the program.

Using the following Risk Scoring Matrix, we will determine which factors have most probability of occurrence and rank of consequence. See table below:

Risk Scoring Matrix

            After assigning to each factor a probability and a consequence we get the following rank:


            The list in order of weight is as follows:

           
Rank of Sensitity Factors


4)    Step 4- Selection of the acceptable criteria.
The following attributes will be considered for the selection criteria:
We will determine which type of contingency can be better applied to variation in each factor and also present a comment or justification in order to respond to tactical response.


5)    Step 5- Compare the outcomes from each alternative analysis done in Step 3 against the minimum acceptable criteria from Step 4.

Once we have identified the most influenced factors that might impact the cost estimate, we can determine what strategy and tactical response we might implement. See the following table:
           
Strategical and Tactical Response


Table below shows what is suggested as strategy in order to allocate contingency. 
Assignation of Contingency


6)    Step 6- Selection of the “best”.
As a result of the suggestion as shown in the Table above, most cost drivers’ variation could be Buffer (7 out of 12) because most of the tactical response cannot be applied to specific activities at this level of the point estimate.
A combination of both can be elaborated. But this depends on risk management processes established to assess contingency regularly.

7)    Step 7- How to plan on tracking/reporting on recommended choice. 

As Sensitivity Analysis is a previous step to Risk and Uncertainty analysis. This can be a preliminary assessment of what strategy should the company or the project team conduct in order to determine if contingency can be Buried in project Accounts or a buffer must be created.
Also, these factors must be:
-       Well-documented sources supported the assumption or factor ranges.
-       Cost-sensitive assumptions and factors were further examined to see whether design changes should be implemented to mitigate risk.
-       Results were well documented and presented to management for decisions.

----------

8)    REFERENCES.
a. Sullivan, W. G., Wicks, E. M., & Koelling, C. P. (2012). Decision making Considering Multiattributes. In Engineering Economy (15th ed.). Harlow, England: Pearson Education Limited.

b. GAO Cost Estimating and Assessment Guide- Best Practices for Developing and Managing Capital Program Costs. Page 147-151.

c. Guild of Project Controls. (2016, January 05). 04.4 Asses_prioritize_and_quantify_risks_opportunities_-rev_1.00. Retrieved September 15, 2018, from http://www.planningplanet.com/guild/gpccar/asses_prioritize_and_quantify_risks_opportunities

d. Guild of Project Controls. (2016, January 05). 04.5 risk_opportunity_responses_strategies_and_tactics_-_rev1.00. Retrieved September 15, 2018, from http://www.planningplanet.com/guild/gpccar/risk_opportunity_responses_strategies_and_tactics

e. Guild of Project Controls. (2016, January 05). 08.0 Managing Cost Estimating & Budgeting. Retrieved September 15, 2018, from http://www.planningplanet.com/guild/gpccar/conducting-a-cost-risk-analysis

f. H. Lance Stephenson. (2015). Total cost management framework: An Integrated Approach to Portfolio, Program, and Project Management (2nd ed.). Morgantown, WV: AACE International. Page 269. 

Friday, 2 November 2018

W8_PieroAnticona_Sensitity Analysis and Contingency Management

1)    Step 1- Problem or Opportunity Statement
During the preparation of Cost Estimates, GAO recommend as a best practice a Sensitivity Analysis in order to identify Cost Drivers in the Cost Estimate and how it is affected when a change in a cost driver’s value happens. This Sensitivity Analysis must be complemented with Risk and Uncertainty Analysis therefore mitigation steps will be part of the assumptions in a Basis of Estimate Document. This analysis will help to determine ranges of potential cost as a previous step of Risk and Uncertainty assessment.
As explained in the first post of the blog, contingency can be allocated following two strategies. Once is an amount buried in a cost account and another one is a buffer in a cost account.
What is the best strategy that responds to a variation in factors used in sensitivity analysis?
2)    Step 2 – Feasible Alternatives
There are two strategies to allocate contingency. The following options will be taken into consideration:
1.    Include Contingency
a.    Include it and show it and put it in a contingency project account
b.    Include it but Bury it in project accounts

3)    Step 3- Develop the outcomes for each alternative
We will determine which strategy responds better to an impact of the following factors suggested by GAO in a sensitivity analysis:
1.    a shorter or longer economic life;
2.    the volume, mix, or pattern of workload;
3.    potential requirements changes;
4.    configuration changes in hardware, software, or facilities;
5.    alternative assumptions about program operations, fielding strategy, inflation rate, technology heritage savings, and development time;
6.    higher or lower learning curves;
7.    changes in performance characteristics;
8.    testing requirements;
9.    acquisition strategy, whether multiyear procurement, dual sourcing, or the like;
10. labor rates;
11. growth in software size or amount of software reuse; and
12. down-scoping the program.

4)    Step 4- Selection of the acceptable criteria.
The following attributes will be considered for the selection criteria:
We will determine which strategy can be better applied to variation in each factor and also present a comment or justification


5)    Step 5- Compare the outcomes from each alternative analysis done in Step 3 against the minimum acceptable criteria from Step 4.

Table below shows what is suggested as strategy in order to allocate cost for potential variations.

Best strategy
Comment
1.   a shorter or longer economic life;
Buffer
This factor has not defined which phase of development might be shorter or longer.
2.   the volume, mix, or pattern of workload;
Buried
If we can assess what units are impacted by a volume variation we can allocate this range in each work package.
3.   potential requirements changes;
Buffer
During design phases, it is difficult to predict changes in product or project requirements or other variations based on regulatory norms.
4.   configuration changes in hardware, software, or facilities;
Buried
If software is not related to project management activities (software for capital cost control, quantity control, procurement packages, contract management, etc.), there must be a specific account for this package.  
5.   alternative assumptions about program operations, fielding strategy, inflation rate, technology heritage savings, and development time;
Buried
These phases are detailed in the schedule, therefore there are accounts to allocate cost.
6.   higher or lower learning curves;
Buried
This correspond to historical data and it can be always allocated to project activities.
7.   changes in performance characteristics;
Buried
A prediction of bad or good performance it is always linked to specific activities. It cannot be applied to the whole project.  
8.   testing requirements;
Buffer
During pre-commissioning or commissioning phases requirements can varied from original plan.
9.   acquisition strategy, whether multiyear procurement, dual sourcing, or the like;
Buffer
Procurement activities might differ for each procurement package in function of new technologies, availability of providers, location, etc.
10.         labor rates;
Buried
Depending if there are unions or not. Labor rates always can get an impact in the long term. It can be distributed to each package.
11.         growth in software size or amount of software reuse; and
Buffer
There is always a risk that data in project has to be managed by more resources. It is difficult to quantify the data to administrate in a project.
12.         down-scoping the program.
Buried
When down-scoping it is necessary to identify which deliverables will not longer be executed, therefore some risk also might disappear.
It is recommended a new risk assessment, then an updated management plan must be implemented.  


6)    Step 6- Selection of the “best”.
As a result of the suggestion as shown in the Table above, most cost drivers’ variation could be Buried (7 out of 12) because they impact to specific activities or resources that can be distributed in the cost structure of the project.
A combination of both can be elaborated. But this depends on risk management processes established to assess contingency regularly.

7)    Step 7- How to plan on tracking/reporting on recommended choice. 

As Sensitivity Analysis is a previous step to Risk and Uncertainty analysis. This can be a preliminary assessment of what strategy should the company or the project team conduct in order to determine if contingency can be Buried in project Accounts or a buffer must be created.
Also these factors must be:
-       Well-documented sources supported the assumption or factor ranges.
-       Cost-sensitive assumptions and factors were further examined to see whether design changes should be implemented to mitigate risk.
-       Results were well documented and presented to management for decisions.

----------

8)    REFERENCES.

GAO Cost Estimating and Assessment Guide- Best Practices for Developing and Managing Capital Program Costs. Page 147-151.
Guild of Project Controls. (2016, January 05). 08.0 Managing Cost Estimating & Budgeting. Retrieved September 15, 2018, from http://www.planningplanet.com/guild/gpccar/conducting-a-cost-risk-analysis

H. Lance Stephenson. (2015). Total cost management framework: An Integrated Approach to Portfolio, Program, and Project Management (2nd ed.). Morgantown, WV: AACE International. Page 269. 

W20_Dashboard with Business Intelligence 3

1)      Step 1- Problem or Opportunity Statement A BI dashboard is a tool that transforms information and displays Key Performance Indi...
