1) Step 1- Problem or Opportunity Statement
Most of Public Projects do not allow to add contingency to their budgets. Public Projects processes and plans to design and execute future assets are not different from private enterprises. Therefore, Public Projects are not exempt from risk and opportunities when executing project activities. When a risk or opportunity occurs sometimes an impact needs the best as you could predict, a tactical or strategical response.
What are best practices to a Risk Management Process that can help to implement the best strategical or tactical response to an event and especially that can adapt to Public Projects if we want a high confidence level of probability to meet project point estimates?
2) Step 2 – Feasible Alternatives
Most common best practices are:
1. Project Management Body of Knowledge (PMBOK) from Project Management Institute
2. Total Cost Management Framework (TCM) from AACE International
We are going to add:
3. Compendium and Reference (CaR) from Guild of Project Controls
The three of them offer Risk Management Process Maps. See maps below:
1. PMBOK – PMI
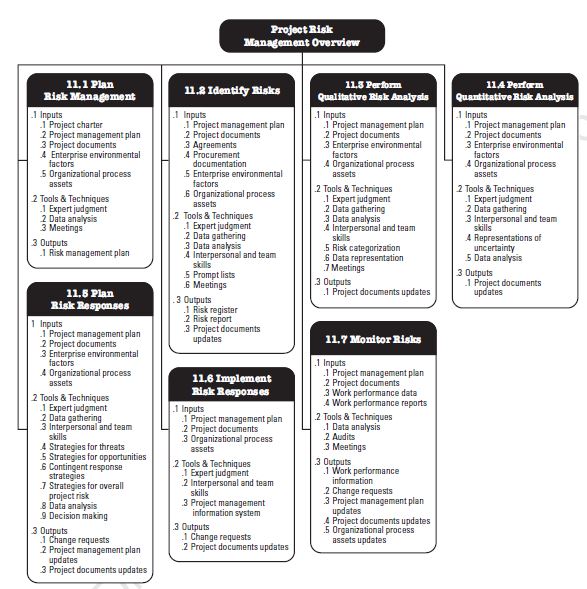 |
| PMI- Risk Management Process Map |
2. TCM – AACE International
 |
| TCM - Risk Management Process Map |
3. Guild of Project Controls
 |
| GPC - Risk Management Process Map |
3) Step 3- Develop the outcomes for each alternative
As explained above, we need to determine which of the three offers better tools or techniques to respond to impacts when events occur.
As explained above, we need to determine which of the three offers better tools or techniques to respond to impacts when events occur.
We will analyze risk/opportunities response on strategies and tactics to treat risk/opportunities. What are the steps to implement a plan to treat risk/opportunities? Let’s see following lists:
 |
| Comparison of Tools and Techniques |
For an effective analyze, we are going to eliminate those tools or techniques that are similar in the three groups. The main reason is that as they are similar, results will be the same for the three groups. So, it will not produce a differentiator between them which might not add value to the analysis. Also, Expert Judgement can be eliminated because as shown in the table above an individual or group of experts will produce the same responses as described in another item that will go for further analysis.
.
 |
| Eliminated items |
Therefore, we only are going to analyze the following list. TCM as all of the tool and techniques are similar to PMBOK and GPC is eliminated for the analysis.
To facilitate the analysis we are going to list the outcomes alternatives as follows:
 |
| Final Tools and Techniques for Analysis |
1
|
PMBOK – Data Gathering
|
PMBOK-DG
|
2
|
PMBOK – Interpersonal and Team Skills
|
PMBOK-I&TS
|
3
|
PMBOK – Strategies for Threats/Opportunities Escalate
|
PMBOK-Escalate
|
4
|
PMBOK – Contingent Response Strategies
|
PMBOK-Contingent
|
5
|
PMBOK - Data Analysis
|
PMBOK-DA
|
6
|
PMBOK – Decision Making
|
PMBOK-DM
|
7
|
GPC – Buffer vs. Contingency
|
GPC-BvsCont
|
8
|
GPC – Decision Trees using EMV
|
GC-EMV
|
4) Step 4- Selection of the acceptable criteria.
The following attributes will be considered for the selection criteria:
- Mandatory to Produce a Quantitative response
- It is possible to be assigned to project budget accounts
- Increase Probability to Meeting Point Estimates
- Mandatory to Produce a Quantitative response
- It is possible to be assigned to project budget accounts
- Increase Probability to Meeting Point Estimates
5) Step 5- Compare the outcomes from each alternative analysis done in Step 3 against the minimum acceptable criteria from Step 4.
Using Multiattribute Decision Making, we will analyze as follows:


Using Multiattribute Decision Making, we will analyze as follows:
Non Compensatory Models
1. Dominance
Conclusion
We can see that alternative GPC – BvsCont dominate others
2. Satisficing
Conclusion
So far, the only alternative that meets all requirements is GPC Buffer vs Contingency. Alternatives PMBOK-DG,PMBOK-I&TS,PMBOK-Escalate,PMBOK-Contingent can be discarded.
3. Lexicography

Conclusion
GPC BvsCont is better than GPC - EMV
Compensatory Models
1. Non-Dimensional Escaling

Conclusion
The best choice is GPC – BvsCont
2. The additive weighting technique
Conclusion
The best choice is GPC – BvsCont
6) Step 6- Selection of the “best”.
It is important for Public Projects to avoid cost overruns. For that reason, the best choice that meet all of the attribute criteria is GPC – Buffer vs Contingency as shown in the previous step. 5 positive results out of 5.
As Contingency is not allowed it can be hidden or create a buffer so it still complies public policies. In addition, it will help to increase probabilities to meet point estimates.
7) Step 7- How to plan on tracking/reporting on the recommended choice.
A good recommendation for further analysis is to identify which of the three best practices can help to track better this alternative as part of the change management process.
----------
8) REFERENCES.
H. Lance Stephenson. (2015). Total cost management framework: An Integrated Approach to Portfolio, Program, and Project Management (2nd Ed.). Morgantown, WV: AACE International. Page 201.
Guild of Project Controls. (2016, January 05). 04.5 risk_opportunity_responses_strategies_and_tactics_-_rev1.00. Retrieved September 15, 2018, from http://www.planningplanet.com/guild/gpccar/risk_opportunity_responses_strategies_and_tactics
A Guide to the Project Management Body of Knowledge (PMBOK® Guide), 6th ed. Newton Square, Pa: Project Management Institute, Inc. 2017.
Sullivan, W. G., Wicks, E. M., & Koelling, C. P. (2012). Decision making Considering Multiattributes. In Engineering Economy (15th ed.). Harlow, England: Pearson Education Limited.


WOW!!! AWESOME ANALYSIS..... (FWIW, James and I just finished exactly the same process analysis against APM's latest publication as well, and we ended up tweaking a couple of definitions but ended up adding/modifying only 4 definitions/processes.)
ReplyDeleteFunny but for years now, I have been arguing that what owners should do is ALLOW contingency (which no contractor in their right mind would NOT include in terms of both time and money) but require the winning contractor to show the contingency (both time and cost) and then report the drawdown of that contingency.
If you look in the upper left hand corner of your Weekly Report, you can see an example of that drawdown graph but at a very high level. (% Spent vs % Earned vs % Elapsed Time)
Great blog posting and I hope to see more like this and see how you incoporate it into your paper.
BR,
Dr. PDG, Jakarta